
Heikin Ashi charts smooth out normal candlestick noise using an averaged calculation, making trends easier to visually follow at the cost of losing some raw price precision. This FXM680 guide explains how they’re built and how to use them.
Table of Contents
What Is A Heikin Ashi Chart? An In-Depth Overview
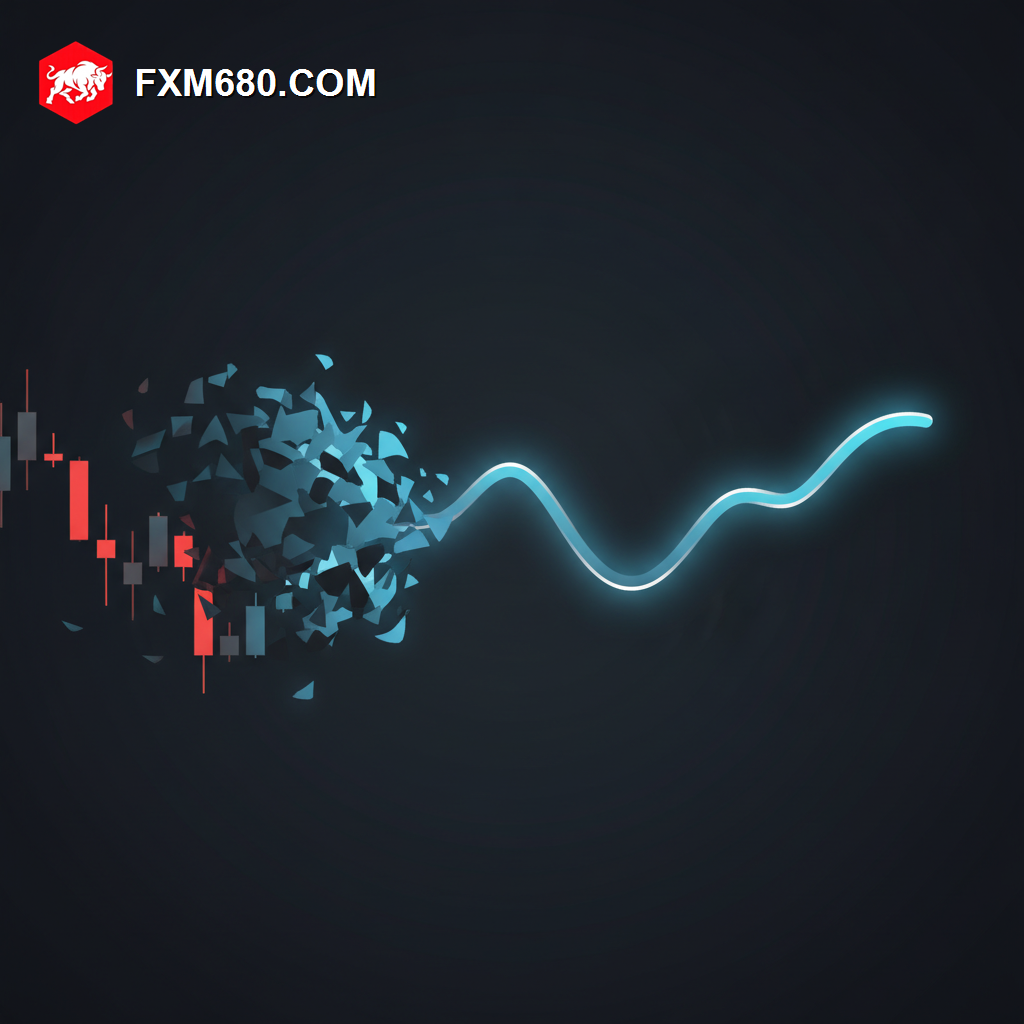
Heikin Ashi, meaning “average bar” in Japanese, is a modified candlestick chart type where each candle’s values are calculated from an average of the current and previous periods, rather than plotting raw open, high, low, and close data directly. The result looks similar to a standard candlestick chart at first glance, but the smoothing effect changes how trends and reversals visually appear.
Why Heikin Ashi Matters for Traders
Standard candlestick charts can look noisy during choppy conditions, with frequent small-bodied candles and long wicks in both directions making the underlying trend hard to read at a glance. Heikin Ashi’s averaging process smooths this out considerably, producing longer runs of same-colored candles during genuine trends and making trend direction easier to identify visually, which is the main reason many trend-following traders adopt it.
Detailed Analysis of How It’s Calculated
The Close Calculation
The Heikin Ashi close is the average of the current period’s open, high, low, and close, smoothing out the final price point compared to a standard candle.
The Open Calculation
The Heikin Ashi open is the average of the previous Heikin Ashi candle’s open and close, which is what creates the characteristic smoothing effect that carries forward from candle to candle.
High And Low
The high and low simply take the actual highest and lowest values from the period, unmodified, ensuring the candle still reflects the period’s genuine price extremes even as the open and close are smoothed.
| Heikin Ashi Candle Feature | Typical Signal |
|---|---|
| Little to no lower wick, strong body | Strong uptrend |
| Little to no upper wick, strong body | Strong downtrend |
| Small body with wicks on both sides | Indecision or potential reversal |
A Simple Way To Read Heikin Ashi Candles
A long run of bullish candles with little or no lower wick generally signals a strong, steady uptrend, while the equivalent bearish pattern signals a strong downtrend. Small-bodied candles with wicks on both sides often appear near potential turning points, where the smoothed average is no longer confidently leaning in either direction.
The Trade-Off: What Gets Lost
Because Heikin Ashi values are averaged rather than raw, the chart no longer shows the instrument’s actual open and close prices for any given period, which matters for traders who rely on exact price levels for order placement. Many traders address this by keeping a standard candlestick chart open alongside Heikin Ashi, using the smoothed version for trend read and the standard version for precise entry, stop, and target placement.
Common Pitfalls to Avoid
A common mistake is placing orders directly off Heikin Ashi price levels, since the displayed values don’t represent genuine tradable prices for that period. Another is expecting Heikin Ashi to eliminate false signals entirely — it smooths noise but doesn’t guarantee accuracy, and can lag slightly behind a genuine reversal precisely because of its averaging nature.
Frequently Asked Questions
Can Heikin Ashi be used for order entry? Most traders avoid placing exact orders off Heikin Ashi values directly, since they’re smoothed averages rather than genuine tradable prices.
Is Heikin Ashi better than standard candlesticks? Neither is universally better — Heikin Ashi trades some precision for visual clarity, which suits some trading styles more than others.
Does Heikin Ashi work well in ranging markets? Like most trend-smoothing tools, it’s generally more useful in trending conditions than genuinely choppy, sideways ones.
Continue Your Forex Learning Journey with FXM680
Heikin Ashi builds on standard candlestick reading skills. See Candlestick Chart Explained and Trend Identification Methods next.
Disclaimer: The content provided on this page is for informational and educational purposes only. Trading financial markets involves significant risk. Consult with a certified financial advisor before making any investment decisions.
Keep Learning
Master Every Chart Type
Heikin Ashi is one of several chart types worth knowing. Explore the full FXM680 Forex Academy to learn them all.